What data are available
This page describes the scope and methods of data collection across SEPA's hydrometric network - to learn how these data are stored, and the structure underlying extraction via the API, refer to How the data are structured
Table of contents
Select a section to jump to:
Metadata
Station metadata:
- Station identifiers
- Site identifiers
- Location, in a variety of coordinate systems, with information about the coordinate systems employed
- Local timezone, and offset from UTC
- Catchment identifiers and area
- River identifiers - not defined for rainfall or groundwater stations
- Operational area identifiers and spatial information
The geographical position is identified both by the latitude, longitude (WGS 84) and by the UK National Grid easting and northing.
Time series data
As described, time series data represent time-referenced values of environmental parameters. SEPA's time series API is primarily focused on the observations derived from its hydrometric network. The data may be:
- observed, i.e. a field measurement, or
- derived, i.e. a calculated value, indirectly dependent on one or more observed data values.
Furthermore, derived data may be:
- aggregated, whereby they no longer maintain the (high) resolution of the raw observations, but are reduced to coarser summary values of some characterising statistical aggregation.
For instance, the 96 values of instantaneous (river) level observed at 15-minute intervals during a single day are used to derive corresponding estimates of (river) flow which are, in turn, aggregated to produce single daily values of mean, minimum, and maximum flow. Refer to the time series catalogue for the full list of Level time series.
Timeseries data from the API is stored and returned in GMT by default. (Data can be cast to British summer time by using the timezone=Europe/London)
Primary Hydrological Parameters
These data provide the fundamental measure of Scotland's natural water resource by monitoring rainfall and the water in the ground, in lochs, and flowing in our rivers.
Hydrology and hydrometry are established scientific engineering disciplines - the data made available via SEPA's Time Series API may be better appreciated in the light of at least the fundamentals of these disciplines, particularly the hydrological cycle.
High resolution observations are generally replicated at each station, usually with one or more ancillary sensors which may be connected to telemetry for automatic upload to the archive or to on-site loggers for periodic download during maintenance visits by SEPA's hydrometry field staff. Hence, in the primary archive, each parameter may be ascribed more than one high resolution environmental measurement time series for redundancy to safeguard the continuity of the archive against sensor malfunction or calibration drift. The duplicate archive sourced by the API stores only a single high resolution time series for each station parameter; this will be populated with live data from the stations' primary sensors and will be periodically updated and overwritten with quality-controlled data from whichever sensor is deemed most accurate.
N.B. all of SEPA's hydrometric data are timestamped in GMT, so during British Summer Time (BST) data may appear to be an hour old.
Rainfall
observed
SEPA manages a network of automated ‘tipping bucket’ rain gauges. These record the time of each 0.2mm of rainfall (as event data) - so, 1mm of rainfall will be represented by five individually timestamped observations; clearly, if the rain is intense these observations will be in quick succession. The event data are automatically aggregated within the station's data-logger into 15-minute totals, i.e. the sum of the rain that has fallen in 15 minutes.
SEPA also receives data from public rainfall observers who operate manually read storage gauges.
Event rainfall and storage rainfall are represented as separate parameters within the archive.
Groundwater
observed
This is the level of water in a borehole or other underground chamber, measured as depth below an established local datum level. Groundwater level varies relatively slowly, so data loggers tend to be manually downloaded periodically with very few stations supporting automatic data transfer.
River Level (Stage)
observed
River level is also referred to as stage, and is measured in metres (m) above an established local datum level. The local datum is referenced to Ordnance Datum (Newlyn).
Stage data is collected at gauging stations using a variety of electronic sensors and data loggers.
The data is recorded every 15 minutes, then transmitted automatically via telemetry at least once a day, although generally more frequently as demanded by operational purpose.
River Flow (discharge)
derived
River flow or streamflow is also referred to as discharge, or volumetric flow, which is the volume of water passing a specific point in a channel during a specified period of time. It is measured in cubic metres per second (m3.s-1), also referred to as cumecs. Instantaneous values are derived from the continuous observations of Stage (observed river level) via a site-specific calibration (a Rating Curve or Rating Equation), which is in turn created from a collection of individual paired stage and flow observations (gaugings).
Gaugings
A river gauging is a specific measurement of river flow at a specific stage. Gaugings are distributed across the full range of stage in order to create a rating curve (calibration).
SEPA's hydrologists have a range of techniques and technologies at their disposal when determining river flow, ranging from long-established mechanical methods using rotating-element current meters (with flow-driven impellors) submerged at intervals across the breadth of the river, to sensors which use the frequency-shift of sound pulse echoes to estimate velocity throughout the water depth. Methods of deployment also vary considerably, from handheld instruments collecting spot measurements whilst wading across the river, using cableways and winches, or the more modern - and lower physical risk - use of remote-controlled boats to collect continuous vertical and horizontal measurements.
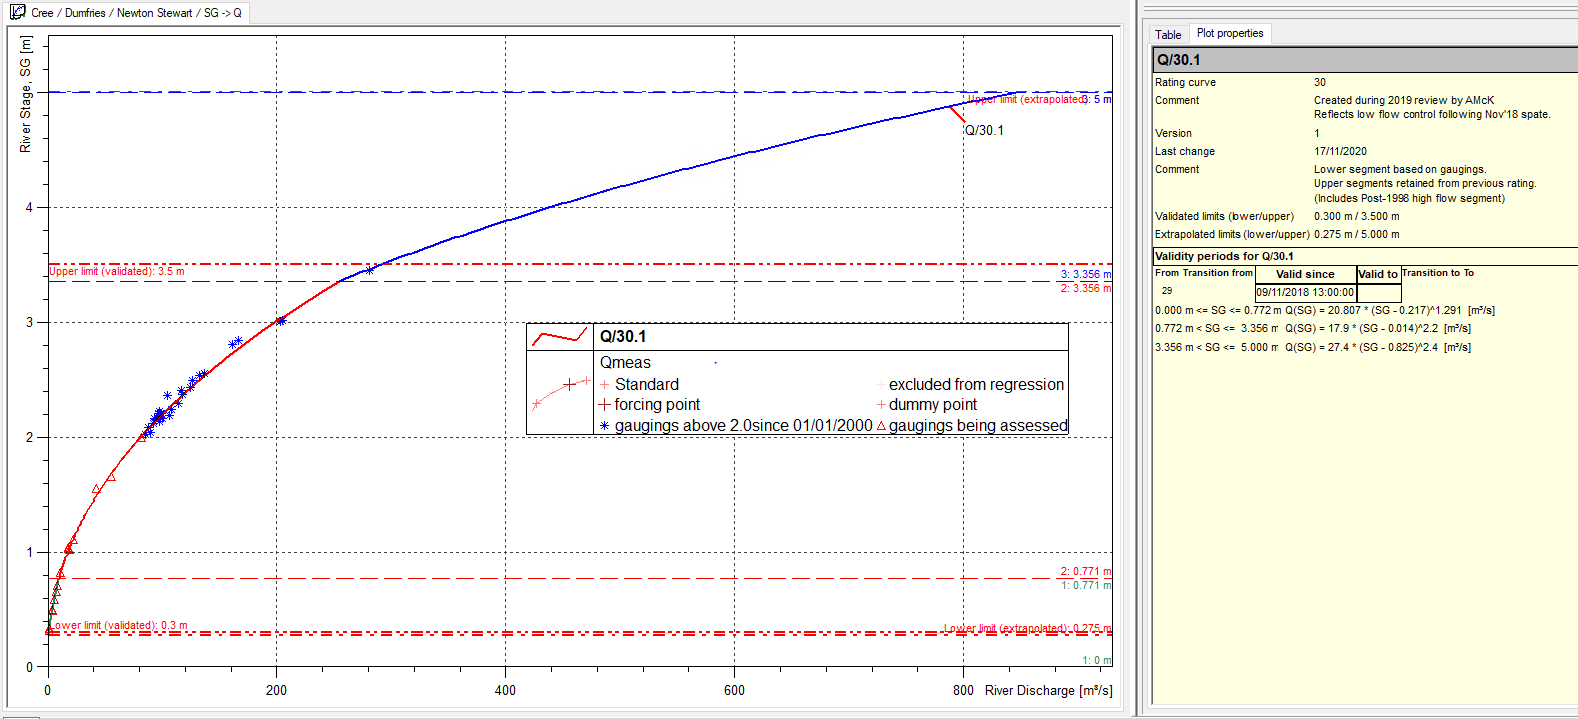
Rating Curves
These are equations which describe the relationship between stage and flow, created using the gaugings and experienced knowledge of the site. It can also be referred to as the stage-discharge relationship. The rating curve will cover the stage range of the gaugings, and can be extrapolated beyond where confidently feasible, or where modelling can be carried out.
Regardless of the method used, regular gaugings are vital to maintain accurate calibration of the gauging station as shifts in the river over time (e.g. channel scour or deposition of gravel during high flows) will alter the relationship between river level and actual flow.
Example rating curve : the red crosses and blue stars represent field observations of level and flow (gaugings), and the calibration line is used to generate live estimates of flow from the observed level data.
Tidal Level
observed
SEPA operates several tidal level gauges which record the height of the sea water level, measured in metres (m) above an established level. It refers to the height of the sea measured against a calibrated reference post. The data is collected using a variety of electronic sensors and data loggers, and is recorded every 15 minutes.