How the data are structured
Data in the archive are organised within a hierarchy and identified via strict naming conventions.
Table of contents
Select a section to jump to:
- Overview of the data structure
- Hierarchy
- Hydrological and Calendar Time intervals
- Long-term values
- Catalogue of time series names
The structure of data in the archive
The data, representing observed environmental information, are referenced by where, what, and how often, i.e.
- where were they observed - their position in the world,
- what was measured - the conditions they describe, and
- how often were observations made - this may also describe whether observations are regular or irregular.
Accordingly, each time series of individual data measurements may be identified by either of two systems:
- a unique identifier, the time series ID; ts_id, or
- a logical hierarchy of text identifiers that specify:
- the location,
- the spatial identifier
- the environmental parameter,
- the categorical identifier
- how often individual data-points are available
- this represents the temporal resolution of the data.
- the location,
Either identification system can be used in an API request to specify which data to return.
| Spatial | Categorical | Temporal | ||
|---|---|---|---|---|
| Where? | What? | How often? | ||
| Hierarchy | Site | Station | Parameter | Time series |
| Unique integer identifier | site_id | station_id | parameter_id | ts_id |
| Free text label | site_name | station_name | stationparameter_name | ts_name |
| Unique text label | site_no | station_no | stationparameter_no | ts_shortname |
| ts_path | site_no/station_no/stationparameter_no/ts_shortname | |||
N.B. the free text labels are not constrained to be unique; although, in general, station_name and ts_name values are unique.
In the case of stationparameter_name, 'Rain' is used for both the RE and RS stationparameter_no categories.
The key hierarchical identifiers for data are:
- the Site
- the Station
- the Parameter and
- the Time series (type)
The time series type indicates what sample or statistic of the parameter is represented by the values in the time series, e.g. instantaneous value, day mean, annual maximum, &c.
Together, these key identifiers make up a path to the data - the ts_path. Analogous to the path to a file in a computer filesystem, the time series path can be used in certain API query functions to specify which time series data to return. When used in a data request, the ts_path can include wildcards to access data from a whole class of time series.
Example: a selection of time series data values with both their path identifiers and their time series IDs
| station_name | site_no | station_no | stationparameter_no | ts_shortname | ts_id | tstamp | value |
|---|---|---|---|---|---|---|---|
| Boreland | 1 | 115518 | RE | HDay.Total | 60199010 | 2022-01-01 09:00:00 | 3.4 |
| Boreland | 1 | 115518 | RE | HDay.Total | 60199010 | 2022-01-02 09:00:00 | 1.2 |
| Boreland | 1 | 115518 | RE | HDay.Total | 60199010 | 2022-01-03 09:00:00 | 5.2 |
| Boreland | 1 | 115518 | RE | HDay.Total | 60199010 | 2022-01-04 09:00:00 | 0.2 |
| Loch Katrine | 1 | 14910 | SG | 15m.Cmd | 70022010 | 2022-01-01 00:00:00 | 0.322 |
| Loch Katrine | 1 | 14910 | SG | 15m.Cmd | 70022010 | 2022-01-01 00:15:00 | 0.313 |
| Loch Katrine | 1 | 14910 | SG | 15m.Cmd | 70022010 | 2022-01-01 00:30:00 | 0.315 |
| Loch Katrine | 1 | 14910 | SG | 15m.Cmd | 70022010 | 2022-01-01 00:45:00 | 0.325 |
| Shenachie | 1 | 234306 | Q | HMonth.Max | 80287010 | 2022-01-01 09:00:00 | 121.076 |
Hierarchy
Site
'Site' is a broad category of location containing many separate measurement stations. Unlike SEPA's primary archive, stations in the API duplicate are ascribed to a single site: its site_no is 1 and its site_name is Stations. This renders the getSitelist query function largely redundant.
Station
Measurements are identified by the station at which they are observed. The station's name is usually based on the name of settlement nearest to the station; it may include the type of gauge at the station, e.g. Hawick, Capenoch Raingauge, and Kingston Tide Gauge.
Explore API requests for station information, including identifiers and metadata amongst the endpoint examples.
Parameter
Each measurable environmental characteristic is identified as a parameter, for instance level, flow, or temperature. Each parameter is ascribed a plain English long name, stationparameter_name, but is identified uniquely by its abbreviated short name, stationparameter_no, or by its parameter_id.
Parameter information can be accessed either on its own or as metadata associated with station or time series data.
A list of available stationparameter_name and stationparameter_no values are shown below in the table of time series types.
| stationparameter_name | stationparameter_no | description |
|---|---|---|
| Rain | RE or RS | RE is data from automatic gauges and RS is data from manually read gauges |
| Groundwater Level | GWL | Readings of the level of water under the ground given in metres above Ordnance Datum |
| Level | SG | The stationparameter_no being technically derived from 'Staff Gauge', this observation of water level in (fresh) surface water is usually measured relative to a local station datum. The reduced level of the local datum relative Ordnance Datum is available as a station additional attribute |
| Flow | Q | Discharge of water from a river, usually in cubic meters per second. Flow measurements, or Gaugings are stored in the Flow parameter. |
| Tidal Level | TL |
Each parameter is stored in consistent units; rainfall in mm, level in m, flow in cumecs (m³.s-1), temperature in Celsius.
Measurements of parameter values are stored in one or more time series.
Time series
The time series are defined by the time interval between the data in the series and the type of observation each measurement represents, either an instantaneous value or an aggregation over the period of the time interval. Time series are ascribed both a descriptive label, ts_name, and unique text identifier, ts_shortname, principally for use in coding.
As an example, instantaneous values measured at a 15 minute interval would be in a time series with ts_name 15minute and ts_shortname 15m.Cmd (in this case the Cmd is an abbreviation for 'continuously measured data'). For rainfall, where the value represents a total over a given interval the highest resolution data have ts_name 15minute.Total with corresponding ts_shortname 15m.Total.
Each parameter has its own structure of time series at various temporal resolution which are generally similar between parameters. The time series resolutions and aggregations are the same at every station for each parameter. A catalogue of the time series types available for each parameter may be found below.
The time series configured under each parameter are broadly the same, so there should be little difference in the available time series between stations per parameter. The exceptions to this rule are:
- For Flow parameters, the time series summarising some high flow data are not available where there is insufficient confidence in the quality
- For Daily observed rainfall data (parameter_no RS), time series for 15-minute and hourly data are unavailable as these data are not measured.
Hydrological and Calendar time intervals
Hydrological science uses the concept of a hydrological day, hydrological month, and hydrological year.
- The hydrological day runs from 09:00 on the given day to 09:00 on the following day
- The hydrological month runs from 09:00 on the 1st of the month and runs up to 09:00 on the 1st of the following month.
- The hydrological year starts on the 1st of October at 09:00 and runs up to 09:00 on the 1st of October the following year.
With reference to time series naming:
- HydrologicalYear is included at the start of the time series name for annual values calculated on the hydrological year.
- The ts_shortname for hydrological time series starts H
- CalendarYear is included at the start of the time series name for annual values calculated on the hydrological year.
- The ts_shortname for time series calculated on the calendar year start C, for example CYear.Total
- Hydrological or Calendar is not used in the time series names for monthly or daily time series, but 'H' is used in the ts_shortname.
These concepts have particular significance for aggregated derived time series.
The daily mean flow for a given date is the total discharge in a river between 09:00 on the given date up to 09:00 on the following. Similarly for rainfall the daily total rainfall is the total amount of rain that fell between 09:00 on the given day up to 09:00 on the following day.
Long-term Values
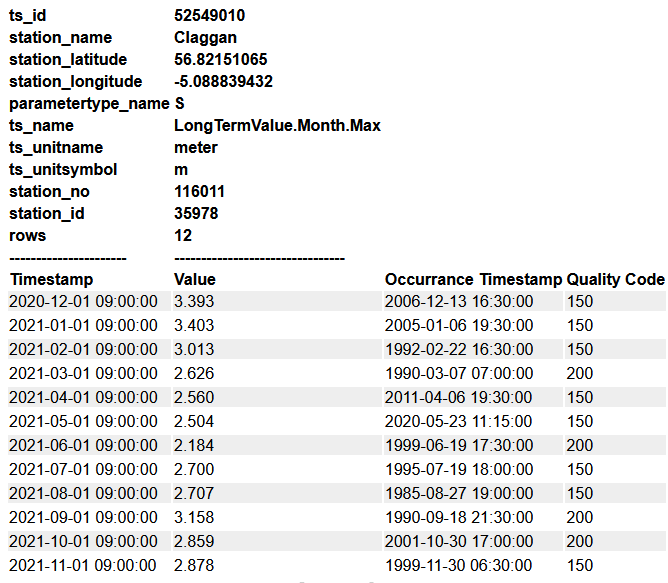
Long-term values are summary statistics available for certain parameters. These time series contain average, maximum, and minimum values for the period of record for each station. The time series have a general date that identifies the broad period that the statistic represents, and where applicable, an occurrence timestamp (sic), which identifies the specific occurrence time within the aggregation period of the statistic.
As an example, the river level Long-term Monthly Maximum represents the highest value recorded in each month of the year across the whole record and, hence, returns 12 values, with the dates on which they occurred.
https://timeseries.sepa.org.uk/KiWIS/KiWIS?service=kisters&type=queryServices&datasource=0&request=getTimeseriesValues&ts_path=1/116011/SG/LTV.HMonth.Max&metadata=true&period=P1Y&returnfields=Timestamp,Value,Occurrance Timestamp,Quality Code,Quality Code Name&dateformat=yyyy-MM-dd HH:mm:ss
Returned values:
Catalogue of time series names
The following tables describe the time series names associated with the available parameters.
stationparameter_name : Rain (stationparameter_no : RE or RS)
| Time Interval of data | Data type | ts_name | ts_shortname |
|---|---|---|---|
| 15 minute * | Total | 15minute.Total | 15m.Total |
| Hourly * | Total | Hour.Total | Hour.Total |
| Daily (Hyd) | Total | Day.Total | HDay.Total |
| Monthly (Hyd) | Total | Month.Total | HMonth.Total |
| Yearly (Cal) | Total | CalendarYear.Total | CYear.Total |
| Yearly (Hyd) | Total | HydrologicalYear.Total | HYear.Total |
| Monthly (Hyd) | Long Term Value Maximum | LongTermValue.Month.Max | LTV.HMonth.Max |
| Monthly (Hyd) | Long Term Value Minimum | LongTermValue.Month.Min | LTV.HMonth.Min |
| Monthly (Hyd) | Long Term Value Mean | LongTermValue.Month.Mean | LTV.HMonth.Mean |
* Not available for RS
stationparameter_name : GroundwaterLevel (stationparameter_no : GWL)
| Time Interval of data | Data type | ts_name | ts_shortname |
|---|---|---|---|
| Hourly | instantaneous | Hour | Hour.Cmd |
| Daily (Cal) | Maximum | Day.Max | CDay.Max |
| Daily | Minimum | Day.Min | CDay.Min |
| Daily | Mean | Day.Mean | CDay.Mean |
| Monthly (Cal) | Maximum | Month.Max | CMonth.Max |
| Monthly | Minimum | Month.Min | CMonth.Min |
| Monthly | Mean | Month.Mean | CMonth.Mean |
| Yearly (Hyd) | Maximum | HydrologicalYear.Max | HYear.Max |
| Yearly (Hyd) | Minimum | HydrologicalYear.Min | HYear.Min |
| Yearly (Hyd) | Mean | HydrologicalYear.Mean | HYear.Mean |
| Yearly (Cal) | Maximum | CalendarYear.Max | CYear.Max |
| Yearly (Cal) | Minimum | CalendarYear.Min | CYear.Min |
| Yearly (Cal) | Mean | CalendarYear.Mean | CYear.Mean |
| Monthly (Cal) | Long Term Value Maximum | LongTermValue.Month.Max | LTV.HMonth.Max |
| Monthly | Long Term Value Minimum | LongTermValue.Month.Min | LTV.HMonth.Min |
| Monthly | Long Term Value Mean | LongTermValue.Month.Mean | LTV.HMonth.Mean |
stationparameter_name : Level (stationparameter_no : SG)
N.B. this includes examples of the ts_path for each timeseries
| Time Interval of data | Data type | ts_name | ts_shortname | ts_path |
|---|---|---|---|---|
| 15 minutes | instantaneous | 15minute | 15m.Cmd | 1/station_no/SG/15m.Cmd |
| Daily (Hyd) | Maximum | Day.Max | HDay.Max | 1/station_no/SG/HDay.Max |
| Daily (Hyd) | Minimum | Day.Min | HDay.Min | 1/station_no/SG/HDay.Min |
| Daily (Hyd) | Mean | Day.Mean | HDay.Mean | 1/station_no/SG/HDay.Mean |
| Monthly (Hyd) | Maximum | Month.Max | HMonth.Max | 1/station_no/SG/HMonth.Max |
| Monthly (Hyd) | Minimum | Month.Min | HMonth.Min | 1/station_no/SG/HMonth.Min |
| Monthly (Hyd) | Mean | Month.Mean | HMonth.Mean | 1/station_no/SG/HMonth.Mean |
| Yearly (Hyd) | Maximum | HydrologicalYear.Max | HYear.Max | 1/station_no/SG/HYear.Max |
| Yearly (Hyd) | Minimum | HydrologicalYear.Min | HYear.Min | 1/station_no/SG/HYear.Min |
| Yearly (Hyd) | Mean | HydrologicalYear.Mean | HYear.Mean | 1/station_no/SG/HYear.Mean |
| Yearly (Cal) | Maximum | CalendarYear.Max | CYear.Max | 1/station_no/SG/CYear.Max |
| Yearly (Cal) | Minimum | CalendarYear.Min | CYear.Min | 1/station_no/SG/CYear.Min |
| Yearly (Cal) | Mean | CalendarYear.Mean | CYear.Mean | 1/station_no/SG/CYear.Mean |
| Monthly (Hyd) | LongTermValue | LongTermValue.Month.Max | LTV.HMonth.Max | 1/station_no/SG/LTV.HMonth.Max |
| Monthly (Hyd) | LongTermValue | LongTermValue.Month.Min | LTV.HMonth.Min | 1/station_no/SG/LTV.HMonth.Min |
| Monthly(Hyd) | LongTermValue | LongTermValue.Month.Mean | LTV.HMonth.Mean | 1/station_no/SG/LTV.HMonth.Mean |
stationparameter_name : Flow (stationparameter_no : Q)
| Time Interval of data | Data type | ts_name | ts_shortname |
|---|---|---|---|
| 15 Minute | instantaneous | 15minute | 15m.Cmd |
| Daily (Hyd) | Mean | Day.Mean | HDay.Mean |
| Gaugings (Flow and Level **) | Instantaneous value | Gaugings | Cmd.Gaugings |
| Instantaneous (*) | Instantaneous peak value | PeaksOverThreshold | POT |
| Yearly (Hyd) (*) | Maximum | HydrologicalYear.Max | HYear.Max |
(* Only available at selected stations) (** Flow is the primary value, level is available as the return field Stagesource Value)
stationparameter_name : TidalLevel (stationparameter_no : TL)
As for Level, above, plus the following.
| Time Interval of data | Data type | ts_name | ts_shortname |
|---|---|---|---|
| Irregular (tide cycle) | Maximum | HighWater | Cmd.HW |
| Irregular (tide cycle) | Minimum | LowWater | Cmd.LW |
| Irregular (tide cycle) | Mean | MeanWater | Cmd.MSL |